“Conversion rates dropped; the new version must be unusable.”
This statement skips two critical questions: Are the metrics truly comparable? Does the change genuinely stem from product experience? An investigation must first rule out changes in definitions, coverage, or denominators before attributing the movement to the business itself.
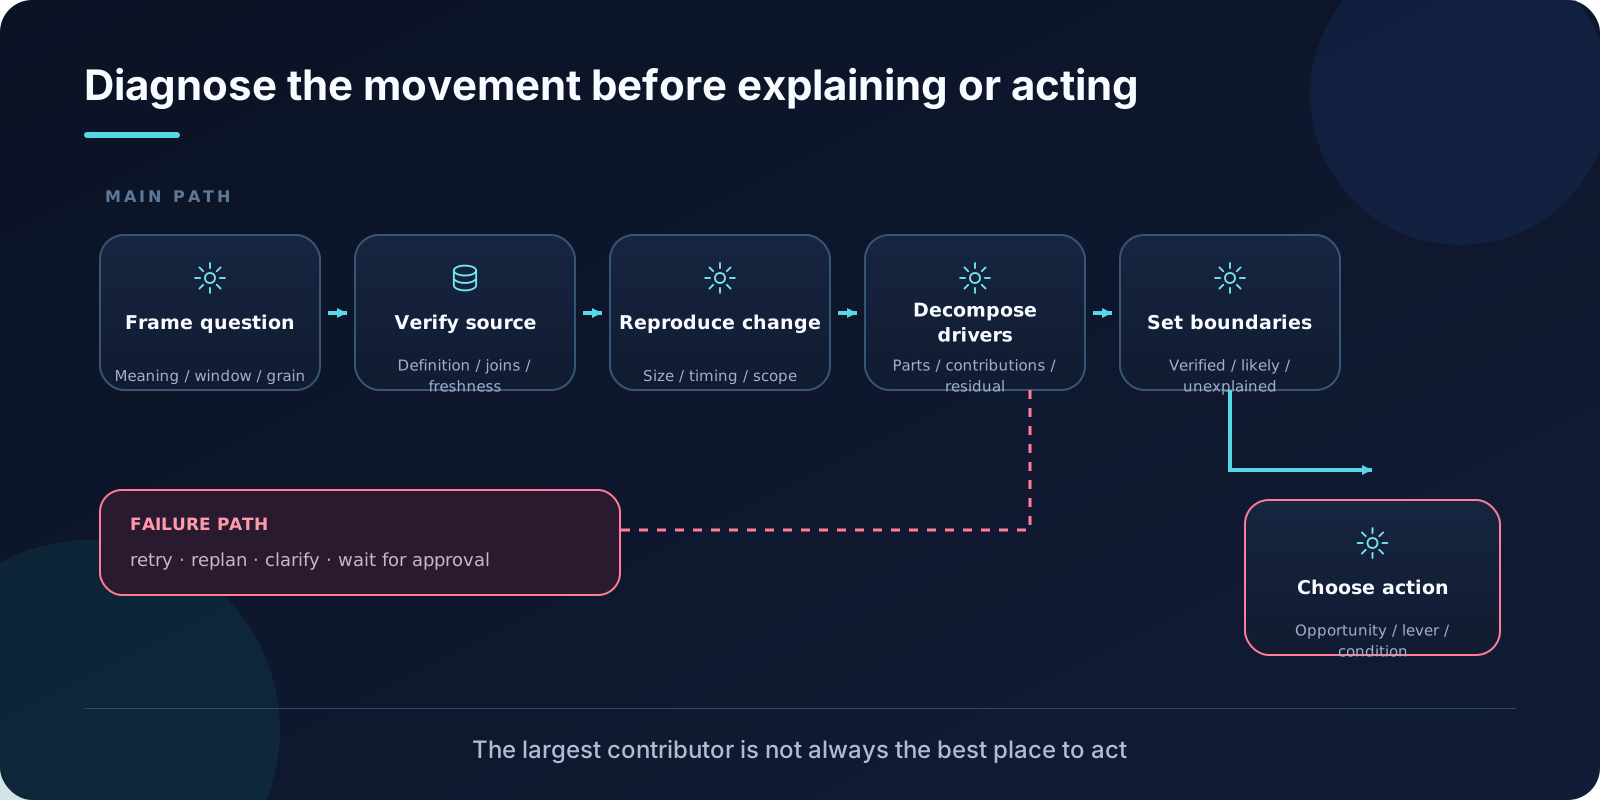
Data Analytics Skills divides this work into two Skills: Metric Diagnostics explains the change, while Product & Business Analysis translates that explanation into evidence-based business decisions. The former owns “what happened,” and the latter owns “what to do.”
Step one is not finding causes, but reproducing the change
The source text breaks down diagnosis into a clear sequence: define the problem, verify the source, establish patterns, and only then decompose drivers.
The step of “establishing patterns” is most frequently skipped. It requires quantifying the scale, timing, and scope of the change: how much did it drop, when did it start, and which user segments and granularities are affected. Before scale, time, and scope are verified or explicitly marked as uncertain, searching for causes should not begin.
Causes are the easiest things to “find.” If one is willing, any decline can be paired with a story that sounds reasonable. Reproducing the change first uses data to narrow the space of plausible explanations.
Verify definitions and sources together
Metric Diagnostics requires confirming metric definitions, granularity, aggregation logic, filters, joins, exclusion rules, timeliness, and lineage, while checking for discrepancies between trusted surfaces.
It also warns against being misled by familiar table names: current context, semantic layer naming, and common table names are merely source candidates, not selected sources. For broad metric issues, one should conduct an actual discovery across available tables, dashboards, metric documentation, and the semantic layer. Simultaneously check a business surface and an underlying source, then explain why the selected source controls this answer.
In practice, this step is often compressed to “use the table we usually use.” If that table’s granularity or filtering does not match the current decision context, all subsequent sophisticated decompositions will be built on a faulty foundation.
Rates, sums, and groupings: three diagnostic paths
The source text provides different diagnostic approaches based on problem type:
- Metric changes: Compare windows against baselines, rank and list group contributions, check peer and historical contexts, and distinguish structural changes from within-group changes.
- Spikes, rollbacks, or incidents: Lock in the start point, peak, recovery, distribution shape (not just the mean), affected slices, and whether traffic or failure behavior changed.
- Concentration and top contributors: First define “top,” then rank, compare shares and changes, identifying major movers, entrants, and exiters.
- Reconciliation and variance analysis: Align definitions, filters, granularity, numerators, denominators, and exclusions; quantify each component; and explain the residual.
For rate-based metrics, determine first whether the numerator or denominator changed. For sum-based metrics, calculate contribution shares. When structural changes and within-group performance shifts occur simultaneously, distinguishing between them often dictates the direction of the explanation.
An example easily misinterpreted
Teaching scenario: A high-conversion channel maintains a constant 20% conversion rate, while a low-conversion channel stays at 5%. In the prior period, traffic was split 50/50 between the two channels, yielding an overall conversion rate of 12.5%. In the current period, traffic share shifts to 20% and 80%, dropping the overall conversion rate to 8%.
Recalculation:
- Prior period: 0.5 × 0.2 + 0.5 × 0.05 = 0.125
- Current period: 0.2 × 0.2 + 0.8 × 0.05 = 0.08
- Difference: −0.045, or −4.5 percentage points
The conversion rate for each channel remained unchanged, yet the overall rate dropped by 4.5 percentage points. This is a classic structural effect (mix shift).
This example illustrates the boundary of diagnosis: arithmetic decomposition can explain “how the change is composed” but cannot prove why channel shares changed. Answering the latter requires further verification of traffic sources and business actions. Labeling a structural effect directly as “declining channel quality” overextends explanatory power.
Measurement issues are explanations, not cleanup tasks
The source text emphasizes specifically that log changes, incomplete recent data, duplicate records, and denominator drift can be genuine causes of change, not merely noise to be “cleaned up.”
This distinction in perspective is significant. If a decline actually stems from a tracking point modification, all hypotheses regarding user experience are rendered moot; if an increase results from backfilling, it represents no business improvement at all.
Therefore, when freshness, granularity, joins, missing data, schema drift, outliers, or distribution shifts might affect credibility, the source text requires invoking Analyze Data Quality rather than bypassing these issues casually within the diagnosis.
From diagnosis to action: change the starting point
The starting point for Product & Business Analysis is not data, but decisions. It requires clearly stating first:
- What decision this analysis supports
- Who will use the answer and what actions they can take
- Which scope and comparisons constitute a useful answer
- Which outcome or behavior truly matters to the decision
- What assumptions are needed to begin
This sequence prevents a common failure: when scope is unclear, analysis automatically expands into broad exploration, ultimately delivering a pile of slices without recommendations.
The judgment lenses provided in the source text include current scale, trends, breadth, concentration, intensity, efficiency, actionability, differentiation, substitutability, risks and dependencies, and coverage. These are thinking tools, not checklists—retain only those that would alter the recommendation.
Highest contribution does not equal highest priority for action
Using the previous case: The high-conversion channel’s contribution warrants investigation, but whether to increase budget depends on cost, capacity, and scalability. Diagnosis tells you where the change is largest; action selection depends on what you can move and what happens when you do.
This is the core division of labor between the two Skills: diagnosis delivers verifiable explanations, while business analysis delivers conditional choices. Connecting them is “evidence capable of changing a decision.”
Recommendations must be handed over with conditions
The source text sets specific requirements for handover: separate verified facts from possible explanations and unexplained elements; clarify next steps, supporting evidence, dependencies, and uncertainties; when evidence is insufficient, mark recommendations as provisional and specify what checks could increase confidence.
Before sharing, use Validate Data to review, then hand off to Build Report to organize the report. Business events occurring concurrently cannot automatically be treated as causal—temporal alignment is merely a condition for proposing a hypothesis, not evidence itself.
When designing your own diagnostic process
Three checks you can apply immediately:
- Before explaining, can you state in one sentence “how much it dropped, when it started, and who is affected”?
- Does every major driver have a quantified contribution share that reconciles with the total or explicitly explains the residual?
- Are conditions clearly stated within recommendations? Recommendations without conditions usually indicate that evidence is not yet sufficient.
Diagnosis delivers verifiable explanations; business analysis delivers conditional choices. Neither promises to “find the truth,” only to clarify the boundaries of the evidence.
Reference: OpenAI Data Analytics Skills public reference repository