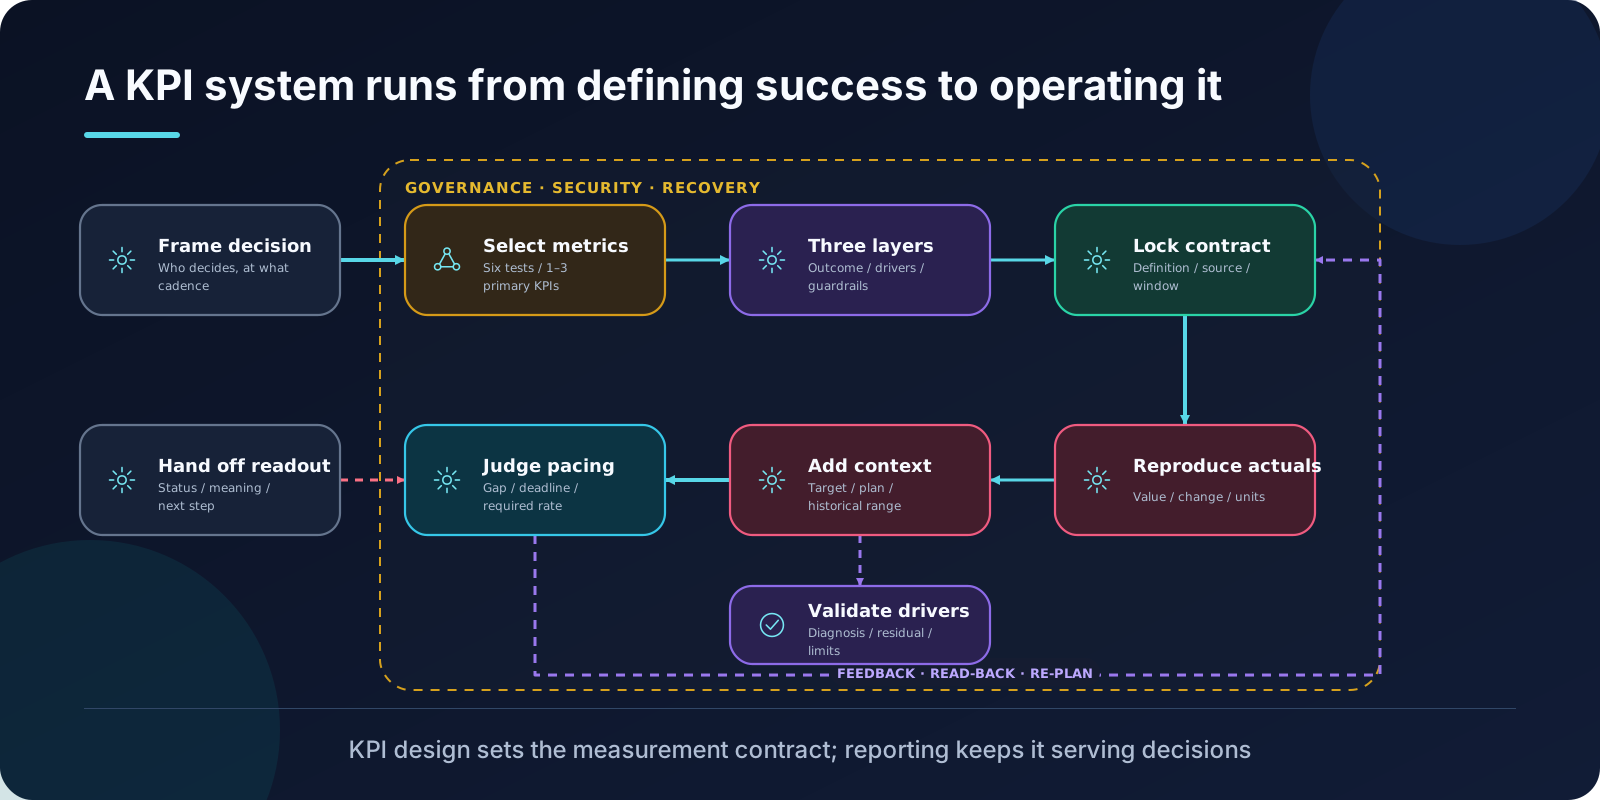
Many teams maintain a long list of KPIs yet cannot clarify three things: what success means, whether they are currently on track, and what the next step should be. As the number of metrics increases, judgment often deteriorates.
Data Analytics Skills breaks this down into two Skills: Design KPIs defines success, while KPI Reporting organizes actual performance, targets, drivers, and actions into operational readouts. Together, they form a closed loop from measurement contracts to sustained operations.
This article provides a structured interpretation based on public Skill documentation. The AI data analytics KPIs mentioned are teaching examples, not official OpenAI metrics; the Skill text describes expected methods and boundaries, representing no real business baselines.
Clarify Decisions Before Selecting Metrics
More metrics are not better, nor are prettier ones. The original Skill text requires answering first: who these metrics support, at what cadence, and for what decisions.
This sequence is easily skipped. Teams typically ask, “Which metrics should we look at?” calculate everything possible, and then select a few that appear important for the dashboard. The result is that every metric has someone responsible for explaining it, yet no one is accountable for “success.”
The original text provides six filtering criteria to serve as a filter for candidate metrics:
| Criterion | Question to Answer |
|---|---|
| Reflects true objectives | Is it the outcome itself, or merely an easily inflated proxy? |
| Drives decision changes | What different actions will the team take when the number changes? |
| Provides timely signals | Can changes be detected within the decision cadence, rather than revealed a year later? |
| Has controllable leverage | Does the team have a way to influence it? |
| Is stably measurable | Can it be calculated consistently and continuously, rather than via one-off manual counts? |
| Resists gaming | Will improving it quietly damage quality, trust, or cost? |
The final criterion is most often underestimated. “Resisting misleading improvement” means the metric itself must include anti-gaming structures: if conversion rates can be improved by relaxing eligibility criteria, that conversion rate must be viewed alongside eligibility metrics.
The original text recommends converging to 1–3 primary KPIs. Each primary KPI should be paired with 1–2 driver metrics for diagnosis and 1–2 guardrails when trade-offs exist. Metrics beyond these are worth adding only if they substantially improve decision-making.
Three-Layer Structure: Outcomes, Drivers, and Guardrails
A metric system is not a flat list but consists of three types of relationships:
- Outcome: What ultimately needs to change.
- Drivers: Which controllable paths influence the outcome.
- Guardrails: Which bottom lines cannot be sacrificed.
Using an AI data analytics product as an example, the teaching setup could be:
| Layer | Example Metric | What It Answers |
|---|---|---|
| Outcome | Completion rate of decision-ready analyses | Do analyses truly support decisions? |
| Drivers | Time to first valid answer, coverage of verifiable sources | Which steps determine the outcome? |
| Guardrails | Rework and error rates, cost per task, end-to-end latency | Are the costs acceptable? |
This structure is more useful than a “single total score” because a total score cannot tell you where to make changes. When outcomes decline, driver metrics indicate whether the issue is slowness or errors; guardrail metrics indicate whether the fix is correct. The original text also warns against inventing causal hierarchies without source definition support. Driver relationships should stem from how the business actually operates, not merely to make a chart look good.
Lock Down Six Definitions Before Reporting
Before pulling data, KPI Reporting requires clarifying six items: definition, source, time, comparison, target, and audience.
| Definition Aspect | Content to Specify Clearly |
|---|---|
| Definition | Numerator/denominator, granularity, inclusion/exclusion rules |
| Source | Which system or dataset controls this number |
| Time | Statistical window, data cutoff time, timezone |
| Comparison | Month-over-month, year-over-year, against target, or against baseline |
| Target | Target value, planned value, cadence definition |
| Audience | Who views it and what decisions they must make afterward |
These are not matters of document pedantry. Definition changes, backfills, denominator drift, missing dates, or event tracking adjustments—any of these can render two numbers incomparable. The original text’s requirement is: before explaining changes, first clarify the reasons for “incomparability.”
If a core definition is unclear, the correct action is to ask for clarification rather than providing a precise conclusion first.
Operational Readouts Must Enable Status Judgment
Once numbers are available, KPI Reporting mandates the following sequence:
- Reproduce actual values, absolute changes, relative changes, and units.
- Contextualize against targets, plans, baselines, or historical ranges.
- Determine if on track, explaining the gap, deadline, required velocity, and basis for status.
Step 3 is most frequently omitted. Reporting “62% complete” is meaningless unless accompanied by: a target of 100%, 40 days remaining, and a required average pace of about 6.65 percentage points per week (38 ÷ 40 × 7).
The original text also imposes a hard constraint: do not draft operational reports with placeholder numbers. If actual data is blocked or insufficient, stop and explain what sources or permissions are needed, unless the user explicitly requests only a template or illustration. This is especially critical in Agent scenarios, as models excel at generating numbers that “look reasonable.”
Causes Require Verification, Not On-the-Spot Invention
The simultaneous occurrence of business events and metric changes does not equal causality. This is one of the clearest boundaries in KPI Reporting: it organizes verified status and drivers but does not invent root causes from thin air.
When readouts require driver explanations, the original text requires entering Metric Diagnostics to quantify major contributions, known non-drivers, and unexplained residuals, then judge based on business context. If credible existing analyses have already verified drivers, they can be cited directly without re-running.
Consequently, readout writing is divided into three categories:
- Verified: Supported by quantified contributions and evidence.
- Possible Explanation: Timing and demographics align, but decisive evidence is lacking.
- Unexplained: Residuals remain unlocated, requiring further diagnosis.
Mixing these three categories is the most common source of distortion in operational reports. Readers cannot determine which statements are actionable for decision-making.
Pre-Handoff Checklist
Before delivery, KPI Reporting requires explicitly documenting the following before handing off to the reporting stage:
- Headline status and operational implications
- Actual values, targets, cadence basis, and comparison periods
- Verified drivers and unresolved uncertainties
- Audience, cadence, and delivery surface
- Chart intent helpful for explaining readouts
It also clearly delineates boundaries: this Skill does not directly render charts; visual selection and quality assurance are handed to Visualize Data. It is also not responsible for final layout and publication. Separating responsibilities ensures that failures in each stage can be pinpointed.
When Designing Your Own KPI System
If applying this methodology to your own team, start with three questions:
- Whose decisions should these metrics change? If the answer is “just for leadership to see,” they are not yet KPIs.
- Does each primary KPI have corresponding drivers and guardrails? Having outcomes without guardrails equals encouraging trading costs for numbers.
- When definitions change, can historical data still align? If not, readouts can only describe the present, not judge trends.
Metric design establishes a measurement contract; operational reporting ensures it continuously serves action. Every readout should make it clearer: where we are now and what to do next.
Reference: OpenAI Data Analytics Skills Public Reference Repository