“Why did conversion fall?” A demo agent can quickly locate a table, write SQL, draw a line, and suggest several causes. Delivery exposes the harder questions: What is the denominator? Is the current period complete? Did channel mix change? Are the “causes” measured contributions or a plausible story?
The Data Analytics Skills are useful because they turn analytical responsibility, handoffs, and completion criteria into reusable work protocols—not because of one special prompt.
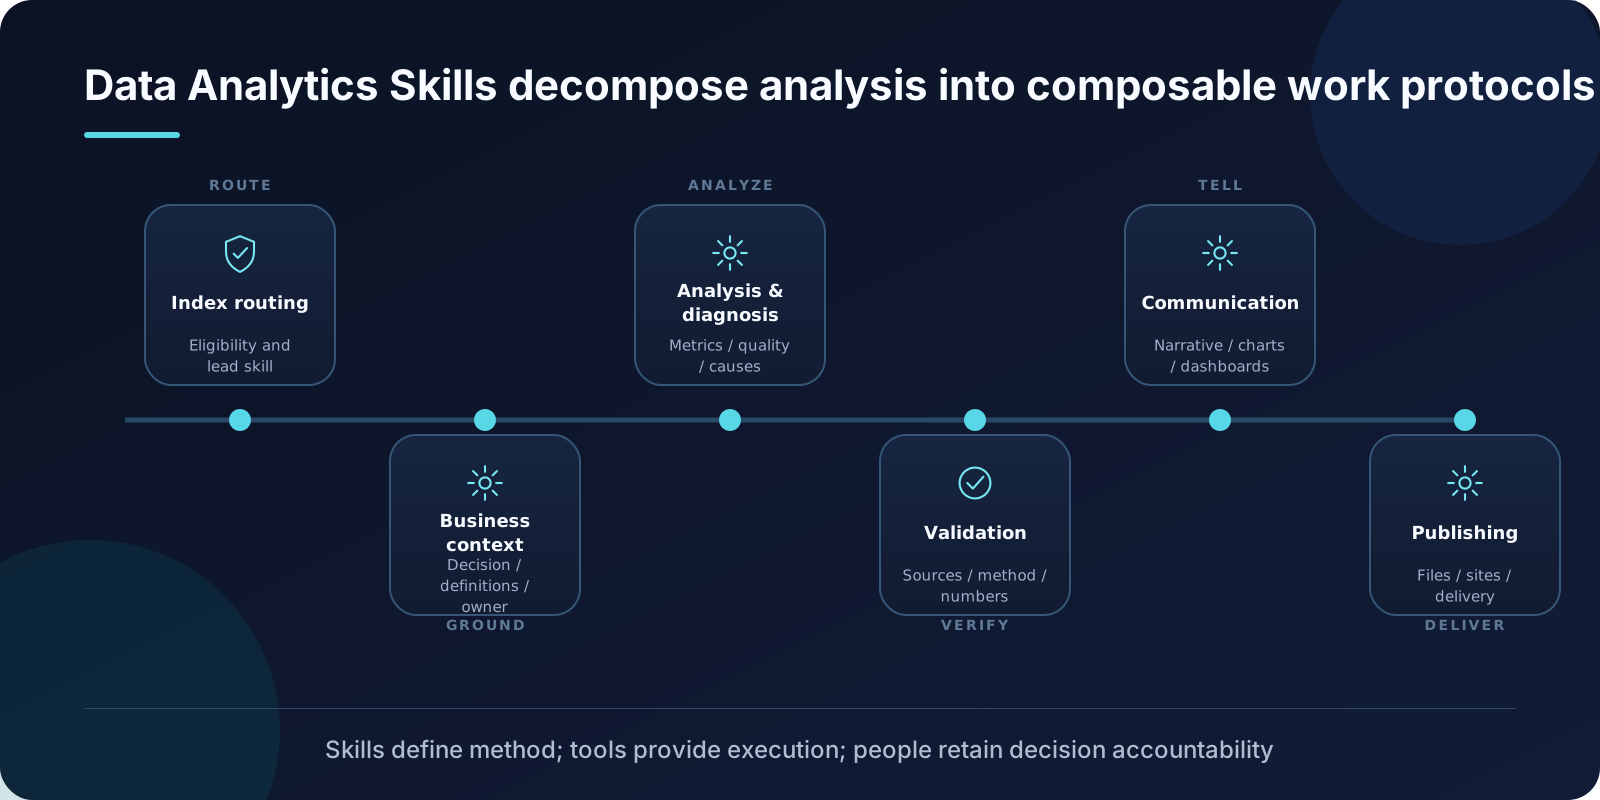
This article interprets 15 Skill documents from the public reference repository at its 2026-10-04 baseline. Skill text describes intended work and boundaries; it does not prove a complete runtime architecture, online authorization, or measured product performance.
Fifteen Skills form five responsibility groups
| Responsibility | Skills | Question answered |
|---|---|---|
| Routing and context | Index, Gather Business Context, Create Data Context | Should this be an analysis task, what temporary context is needed, and what knowledge should persist? |
| Measurement and decisions | Design KPIs, Metric Diagnostics, Product & Business Analysis, KPI Reporting, Market Sizing | What should be measured, what explains change, and what decision does evidence support? |
| Trust | Analyze Data Quality, Validate Data | Is the input fit for purpose, and are method, calculation, and conclusion defensible? |
| Computation and communication | Jupyter Notebooks, Visualize Data | Can work be rerun, and does the visual honestly answer the question? |
| Delivery | Build Dashboard, Build Report, Publish Artifact to Sites | How should the result support monitoring, reading, and bounded publishing? |
This is not a fifteen-step pipeline that every request must traverse, nor evidence that fifteen separate agents are required. The Index selects the smallest sufficient route, and each Skill owns a specific completion condition.
Route the analytical job before the artifact
“Why did conversion decline?” is a diagnostic task. “Create a one-page report on the decline” still requires diagnosis before report assembly. Mentioning a report does not complete the investigation. Conversely, retrieving one governed metric should not expand automatically into a strategic review.
This separation prevents a common failure: many attractive artifacts with no answer to the original question. The lead Skill defines analytical completion; report, dashboard, or notebook defines how the result will be used.
Separate temporary business context from durable semantics
Gather Business Context serves the current task: why now, who decides, what recently changed, and which sources control definitions. Create Data Context captures reusable assets such as metrics, table grain, join rules, filters, query patterns, and caveats.
“This campaign targets newly registered users” is current-task context. “Paid conversion means first payment within seven days of registration, excluding test accounts” may become a durable contract. Accumulating old conversations does not create a coherent semantic layer.
Data quality and conclusion quality are two gates
Analyze Data Quality checks fitness of data: grain, uniqueness, missingness, freshness, joins, and coverage. Validate Data checks the analysis: whether it answered the right question, used fair comparisons and weighting, represented evidence honestly, and stayed inside inference limits.
An order table can be complete and unique, then have revenue multiplied by a one-to-many join. Even a correct value does not allow “conversion fell after release” to become “the release caused the decline.” The first is a data/program defect; the second is an inference boundary.
A channel-mix example
Suppose the prior period has 800 users in channel A at 10% conversion and 200 in B at 2%. In the current period, the population sizes swap while A improves to 11% and B to 3%. Overall conversion still falls from 8.4% to 4.6%.
Prior rates at current mix:
20% × 10% + 80% × 2% = 3.6%

Mix contribution: 3.6% - 8.4% = -4.8 percentage points
Within-channel contribution: 4.6% - 3.6% = +1.0 point
Total: -3.8 points
This descriptive decomposition shows that channel mix can explain the total decline while both channels improved internally. It does not explain why the mix moved or justify cutting channel B. Metric Diagnostics establishes the change; Product & Business Analysis adds cost, long-term value, opportunity, and constraints before recommending action.
Handoffs among measurement Skills
Design KPIs selects primary, driver, and guardrail measures so a team cannot optimize one number by sacrificing an important outcome. Metric Diagnostics reproduces movement, decomposes contribution, and tracks explanation status. KPI Reporting communicates governed metrics; a new anomaly routes back to diagnostics rather than gaining an improvised explanation in the report.
Market Sizing keeps facts, proxies, assumptions, and calculations distinct and shows sensitivity. When evidence is weak, identifying the next valuable input is more useful than additional decimal places.
Notebooks, visuals, dashboards, and reports finish differently
- A notebook preserves inputs, parameters, code, executed outputs, and environment. Written code and executed work are different states.
- A visual matches a question before a chart type; axes, units, denominators, and missing values affect interpretation.
- A dashboard supports repeated monitoring and exploration with consistent filters, time, and metric definitions.
- A report supports one reading path from conclusion through evidence, limitations, and next step.
- Publishing delivers a validated artifact or bounded snapshot; an interactive page is not automatically a live data system.
Several artifacts may share one analysis, but they should reference the same claims, data, and versions rather than diverge through copy and paste.
Applying the Skill pattern to another agent
For each Skill, define entry conditions, inputs, outputs, prohibitions, and completion gates—not only a persona. Preserve queries, parameters, definitions, assumptions, and checks as referenced artifacts. Make validation change the workflow: an invalid denominator returns to computation, while inadequate evidence narrows the claim.
Evaluate with known traps: unequal time windows, join multiplication, Simpson’s paradox, dashboard/query conflicts, destructive partial edits, and code that was written but never executed.
Three questions summarize the design: Can another person find the evidence? Can they recompute material values? Can they understand why the evidence supports the next action? If not, more charts and longer reports have not completed the analysis.
The version baseline and source index are available in the public organized repository.